
Why use Autodesk Forge?
With the emergence of online collaboration platforms – from ProjectWise to BIM360 to Procore – the platform has determined the software with which data has been consumed. But with cloud platforms making their data accessible through API’s, our Software & Analytics team can provide you with a custom dashboard to give management teams a custom overview of the data. These custom dashboards help identify issues quicker and more easily.
What can we do with Autodesk Forge?
Autodesk provides access to BIM 360, Fusion, BIM 360 and the Object Storage Service, amongst others, and provides several services for consuming the data, including design automation and forge viewer. In this post we’ll focus on managing clash detection through PowerBI, including visualizing the clashes in the forge viewer.
Clashes in BIM360
In BIM360 Clashes between model sets are summarized in matrix form and can be visualized using some basic filters. When you have large number of clashes, it is important to break down the clashes further understand root causes and coordinate mitigation.
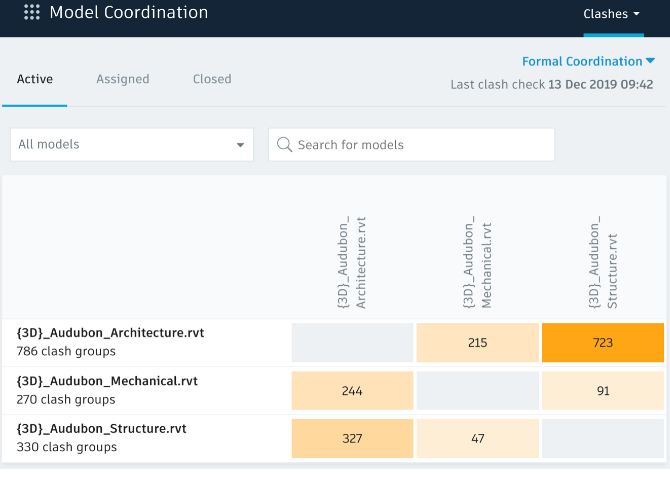
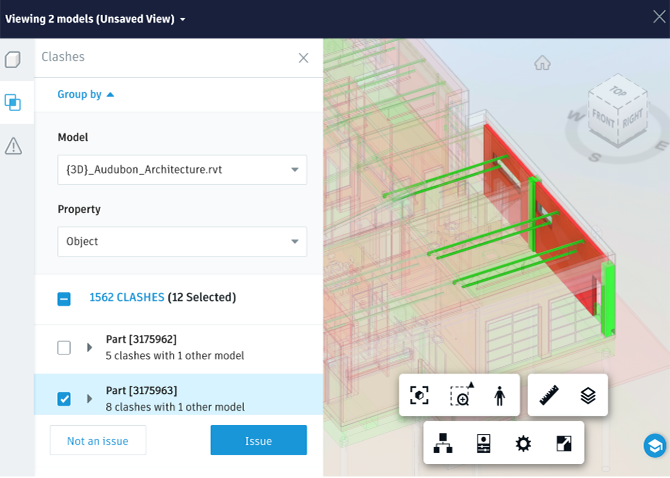
Figure 1 – Clashes in BIM360, source: https://forge.autodesk.com/blog/basic-clash-view-model-coordination-api-nodejs
Clashes through Autodesk Forge API
By accessing the clash data through the document management part of the Forge API’s, we get the basic clash information, primarily:
- model set
- filename
- and element ID
- location
Additionally, by making additional queries to the Forge API a lot more element metadata can be obtained to organize the clashes by. For example, the clashes could be ordered by element materials.
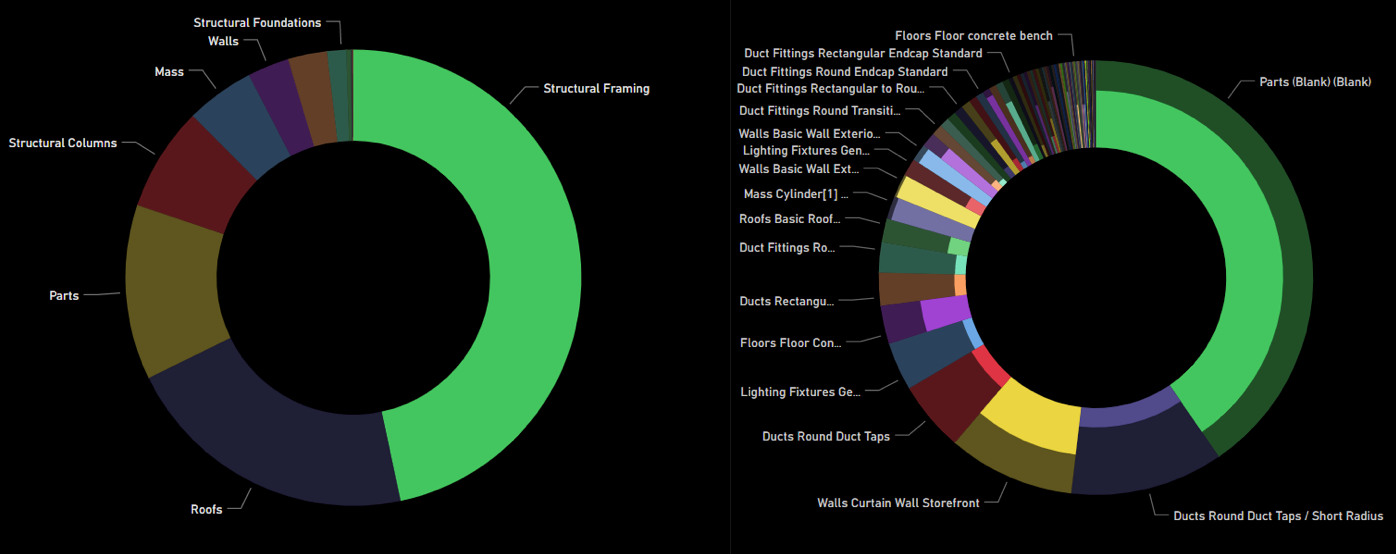
Figure 2 – Clashes in by Type, source: https://forge.autodesk.com/blog/basic-clash-view-model-coordination-api-nodejs
Visualizing the clash data in PowerBI
PowerBI is an excellent analysis platform for processing and visualizing data, and help you visually explore your data. As such, it is a commonly used tool for generating dashboards, with many visualization options available out-of-the-box. And if you feel like they don’t have the visualization you are looking for, you can also embed custom visualizations using d3.js.
The Forge viewer is primarily meant for use in web applications, but a workflow is documented here for embedding it in PowerBI. And for those looking for a one-step integration, please have a look at this PowerBI Plugin:
Figure 3 – PowerBI integration of Autodesk Forge Data, source: https://community.powerbi.com/t5/Data-Stories-Gallery/Revit-file-analysis-and-visualization-with-Autodesk-Forge-viewer/td-p/1232233